Free Access to TSR Screeners - Sign Up for Your Nightly Pass
TSR Screener - 1 min to Qtr Tick, Tech & Funda -
Auto Refresh, Web/Mobile Alert, Back Test | Want to Explore? -
Request For Demo
Double Top (Potential) Scanner
| Code | Price | Chart Patterns | Chart | |||||
|---|---|---|---|---|---|---|---|---|
| AEQUS | 225.97 | [Double Top] | ||||||
| APLLTD | 810.95 | [Double Top] | ||||||
| BAJAJHLDNG | 11134.0 | [Double Top] | ||||||
| BEL | 404.35 | [Double Top] | ||||||
| CCL | 1081.0 | [Double Top] | ||||||
| DIVISLAB | 9322.0 | [Double Top] | ||||||
| MEDANTA | 1447.2 | [Double Top] | ||||||
| GRASIM | 3281.9 | [Double Top] | ||||||
| KARURVYSYA | 333.8 | [Double Top] | ||||||
| LTF | 309.1 | [Double Top] | ||||||
| LTFOODS | 438.1 | [Double Top] | ||||||
| LUMAXTECH | 1993.7 | [Double Top] | ||||||
| NESTLEIND | 1383.3 | [Double Top] | ||||||
| OIL | 489.8 | [Double Top] | ||||||
| PGIL | 1187.7 | [Double Top] | ||||||
| RATEGAIN | 878.25 | [Double Top] | ||||||
| SHYAMMETL | 1074.8 | [Double Top] | ||||||
| SMARTWORKS | 530.75 | [Double Top] | ||||||
| TATACAP | 362.9 | [Double Top] | ||||||
| TITAGARH | 842.15 | [Double Top] |
Double Top (Potential) Scanner
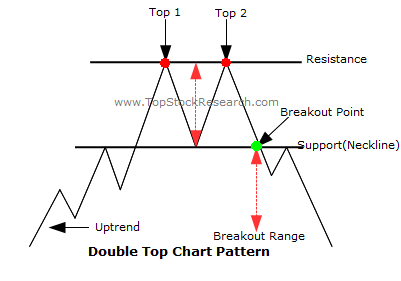
What is a Double Top (Potential)?
Double Top (Potential) is a bearish reversal chart pattern that is still developing after an uptrend. It indicates that buying momentum may be weakening as the price attempts to form a second high near the previous peak. Since the neckline has not yet been broken, the pattern remains unconfirmed and should be monitored for a potential bearish breakdown.
How the Double Top (Potential) Pattern Forms
- The price rises and forms the first high during an uptrend.
- A temporary pullback creates a support level known as the neckline.
- The price rallies again and approaches the previous high.
- The second peak forms near the first high, but the neckline remains intact.
- The pattern becomes confirmed only after the price closes below the neckline.
Trading Strategy
- Monitor the price for a confirmed close below the neckline before entering a bearish trade.
- Many traders place a stop-loss above the second top after confirmation.
- Use trading volume and momentum indicators to validate the potential breakdown.
- Avoid entering early, as the pattern may fail if the price breaks above the recent highs.
Advantages
- Identifies potential bearish reversal setups before confirmation.
- Allows traders to prepare entry and risk management plans in advance.
- Provides clearly defined neckline and resistance levels.
TSR Scanner Features
- Real-Time Alerts: Set up alerts to get notified exactly as the condition meets.
- Fine-Tune Filter: Combine with volume and TSR strength index for better accuracy.
- Custom Tracking: Filter signals based on specific stock baskets or your personalized watchlist.
- Backtesting Capabilities: Evaluate historical data to gain confidence.
- Flexible Timeframes: Filter intervals from 1-minute to monthly ticks.
- Auto Refresh: Keeps your scanner data continuously updated.
Fine Tune : You can customise these screeners by clicking on 'Fine Tune Filter' Option
Caution : All these screeners are crafted based on some historical scenarios which may / may notbe applicable here. We recommend to fine tune them according to current market conditions or seek expert advise before taking any decision.