Symmetric Triangle Breakdown, Tick - HOUR1
| Name | Current Price | Price Change | Top Points | Bottom Points | Chart | |||
|---|---|---|---|---|---|---|---|---|
| DCM | 103.04 | 2.32 % | 105.49 / 03-Jun-25 15:15, 106.60 / 03-Jun-25 09:15, | 104.72 / 03-Jun-25 14:15, 102.05 / 02-Jun-25 11:15, | ||||
| PDSL | 420.65 | 1.49 % | 427.00 / 03-Jun-25 15:15, 440.10 / 30-May-25 15:15, | 418.90 / 03-Jun-25 10:15, 412.35 / 29-May-25 15:15, | ||||
| ENIL | 146.20 | 1.63 % | 148.63 / 03-Jun-25 14:15, 152.63 / 02-Jun-25 09:15, | 146.21 / 03-Jun-25 12:15, 145.10 / 02-Jun-25 15:15, | ||||
| KHAICHEM | 84.10 | 1.65 % | 86.00 / 03-Jun-25 14:15, 86.96 / 03-Jun-25 09:15, | 83.00 / 03-Jun-25 13:15, 77.00 / 02-Jun-25 10:15, | ||||
| UNITEDTEA | 419.85 | 0.979 % | 424.00 / 03-Jun-25 14:15, 428.00 / 02-Jun-25 11:15, | 420.25 / 03-Jun-25 12:15, 416.10 / 02-Jun-25 15:15, |
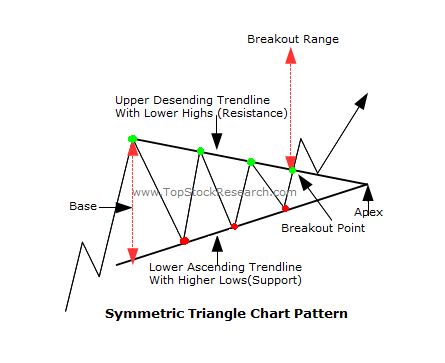
About Screener : Symmetric Triangle Breakdown Screener on ${TICK_TYPE} Tick. Symmetric Triangle is a continuation pattern of high reliability.
Fine Tune : You can customise these screeners by clicking on 'Fine Tune Filter' Option
Caution : All these screeners are crafted based on some historical scenarios which may / may notbe applicable here. We recommend to fine tune them according to current market conditions or seek expert advise before taking any decision.

